
The Profitability Pyramid
A structured financial and operational framework for sustainable growth.
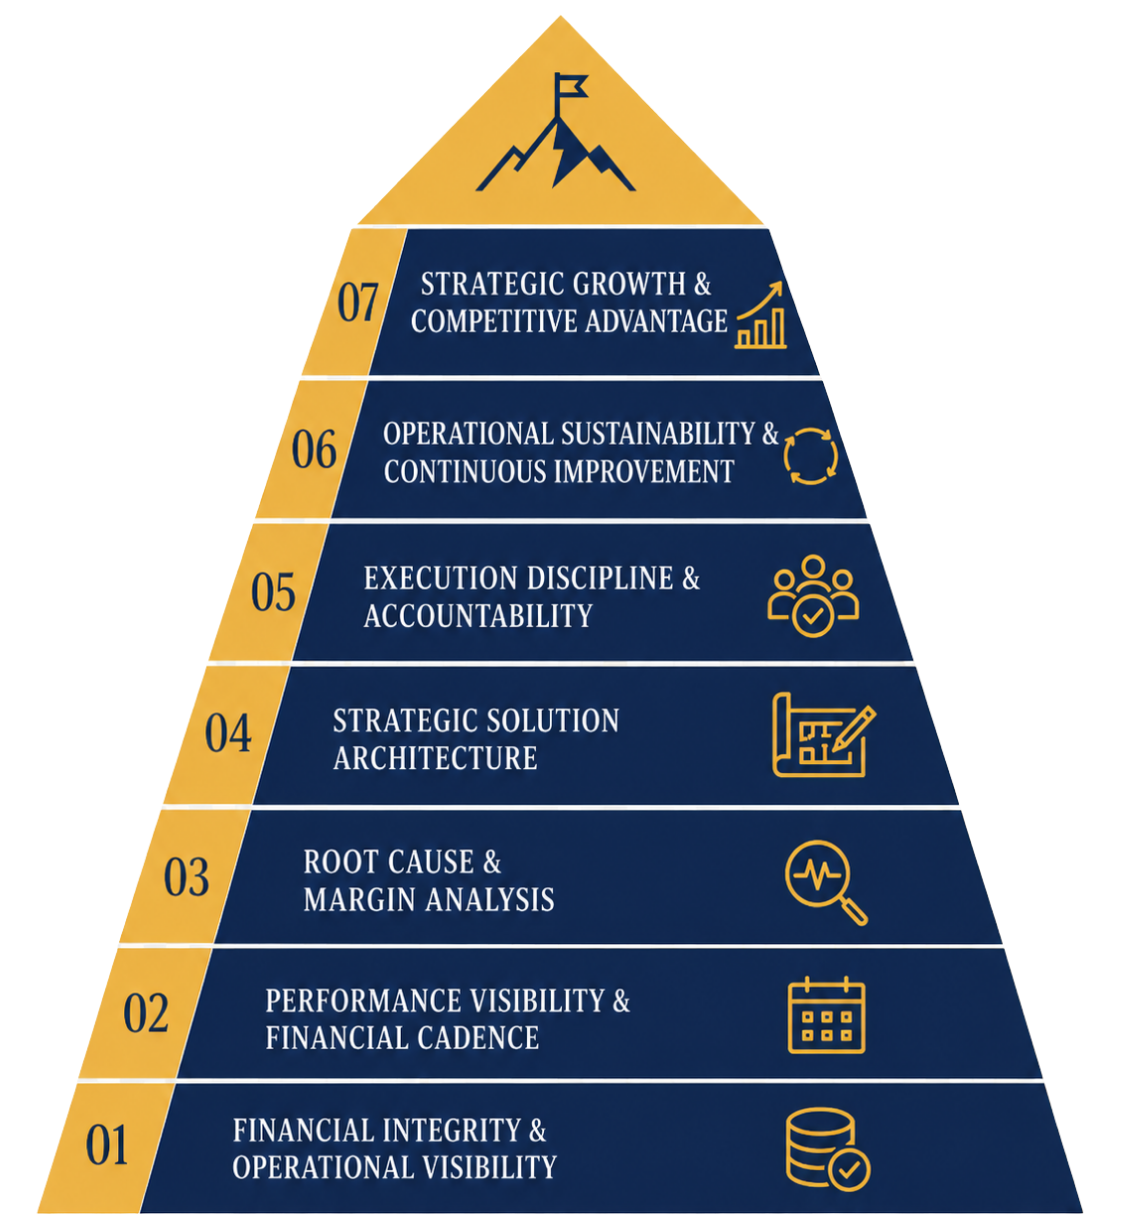
Power CFO’s Profitability Pyramid is a disciplined methodology designed to improve profitability, operational visibility, financial control, and long-term enterprise value. We build operational maturity layer by layer, creating the financial infrastructure, accountability systems, and strategic clarity required for scalable, sustainable growth.

1) Financial Integrity and Operational Visibility
Establishing accurate financials, reliable operational data, and reporting discipline to create a trustworthy foundation for decision-making. Learn more>

2) Performance Visibility and Financial Cadence
Implementing weekly KPI visibility, cash flow monitoring, and structured quarterly financial reviews to improve operational awareness and leadership alignment. Learn more>

3) Root Cause and Margin Analysis
Identifying the underlying operational, financial, and process inefficiencies that suppress profitability and create recurring performance issues. Learn more>

4) Strategic Solution Architecture
Designing targeted financial, operational, and process-driven solutions aligned to long-term scalability and measurable business impact. Learn more>

5) Execution Discipline and Accountability
Driving implementation through structured accountability, operational ownership, and measurable peformance management. Learn more>

6) Operational Sustainability and Continuous Optimization
Creating systems, reporting structures, and continuous improvement processes that prevent regression and support long-term operational resilience. Learn more>

7) Strategic Growth and Competitive Advantage
Building a financially disciplined, operationally mature business that grows predictably and commands higher enterprise value. Learn more>
Request a Free Consultation
The Profitability Pyramid
1) Financial Integrity and Operational Visibility
2) Performance Visibility and Financial Cadence
3) Root Cause and Margin Analysis
4) Strategic Solution Architecture
5) Execution Discipline and Accountability
6) Operational Sustainability and Continuous Optimization
7) Strategic Growth and Competitive Advantage
How much could you recover?
In just five minutes, you can find out how much income you could be leaving on the table. Take the Profitability Pyramid diagnostic test.